Understand what your portfolio is really doing
A portfolio should not be judged only by whether it is up or down. That is too superficial to be useful.
What matters is how returns are being generated, how risk is distributed, how much of the portfolio’s behaviour is driven by the benchmark, and whether individual positions are actually improving the structure of the whole portfolio or simply adding noise.
This is the purpose of Portfolio Analysis inside BTi.
While Strategic Asset Allocation is about building an efficient portfolio structure over the long term, Portfolio Analysis is about understanding how a real portfolio behaves once positions are in place. It is the module designed to help active investors move beyond simple performance observation and into actual portfolio diagnosis.
In practical terms, Portfolio Analysis allows you to input your holdings, assign portfolio amounts, save and reload portfolio configurations, and analyse the result through a structured set of portfolio metrics and performance views. The module is built around the same risk-and-return logic used elsewhere in BTi, and includes benchmark comparison and contribution analysis at position level.
What Portfolio Analysis is
Portfolio Analysis is the BTi feature dedicated to evaluating an existing portfolio from multiple angles at the same time.
It is not a portfolio tracker in the retail sense. It does not simply show holdings and aggregate performance. It is a portfolio intelligence layer designed to answer the questions that actually matter for an active investor.
How much return is the portfolio expected to generate over time?
How much volatility is required to achieve that return?
How dependent is the portfolio on the market benchmark?
Which positions are contributing positively to performance, and which are contributing disproportionately to risk?
Is the portfolio behaving better or worse than the benchmark?
Is the current structure consistent with the investor’s objective?
These are the questions that separate monitoring from analysis.
Inside BTi, the feature is built to make this process operational. The user can create a portfolio by name, input multiple instruments directly, assign an amount to each position, save the configuration and reload it later. The module stores portfolios locally and reloads them clearly, which makes it usable not just for one-off checks, but as a recurring workflow for reviewing and refining actual portfolio structures.
This is why Portfolio Analysis matters. It turns a portfolio from a list of holdings into a measurable system.
What it is for
The practical purpose of Portfolio Analysis is simple: to help the investor understand the structure, quality and drivers of a portfolio before making allocation decisions.
Most investors look at a portfolio and ask only one question: “How is it performing?” A serious portfolio process requires more than that. A portfolio can be up and still be weak. It can be diversified on paper and still be highly concentrated in risk terms. It can contain several strong positions and still behave inefficiently as a whole.
Portfolio Analysis exists to reveal those hidden layers.
In BTi, this happens through two complementary dimensions.
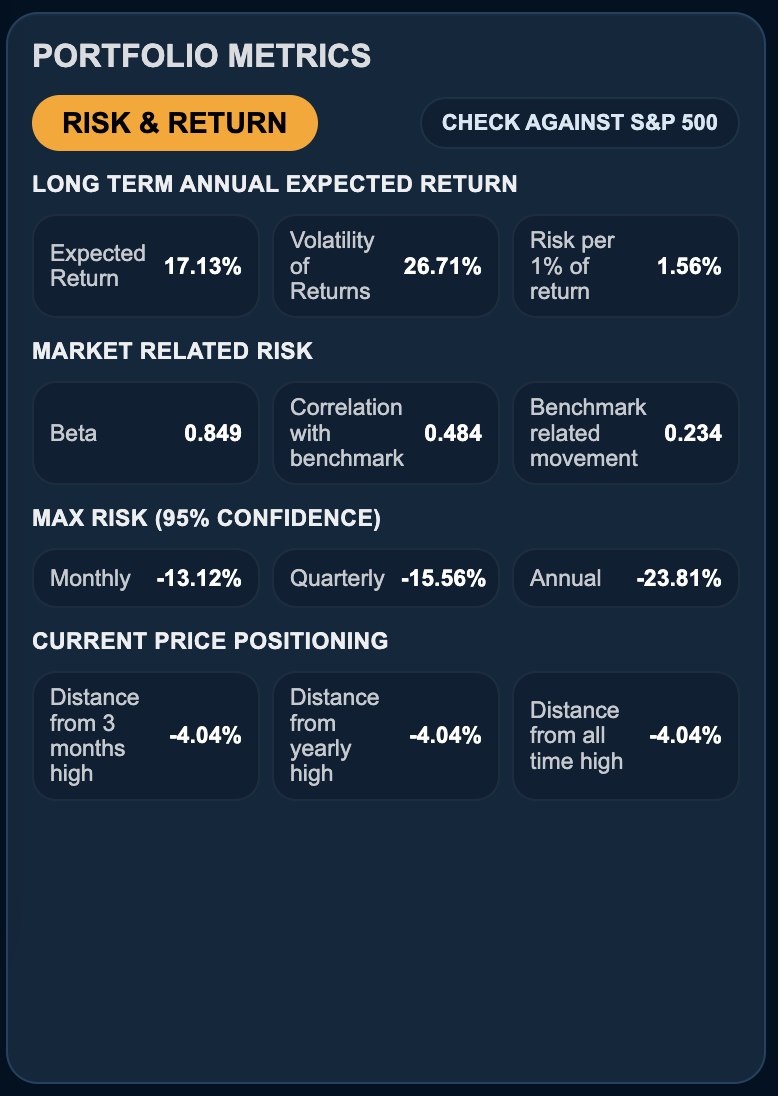
The first is Portfolio Metrics. This is where the portfolio is analysed through a structured risk-and-return framework, including expected return, volatility, beta, correlation with benchmark, benchmark-related movement, Value at Risk and current price positioning. The structure shown in the interface makes this explicit: the analysis is not limited to one headline number, but broken into long-term annual expected return, market-related risk, maximum risk under a confidence framework, and current price positioning.
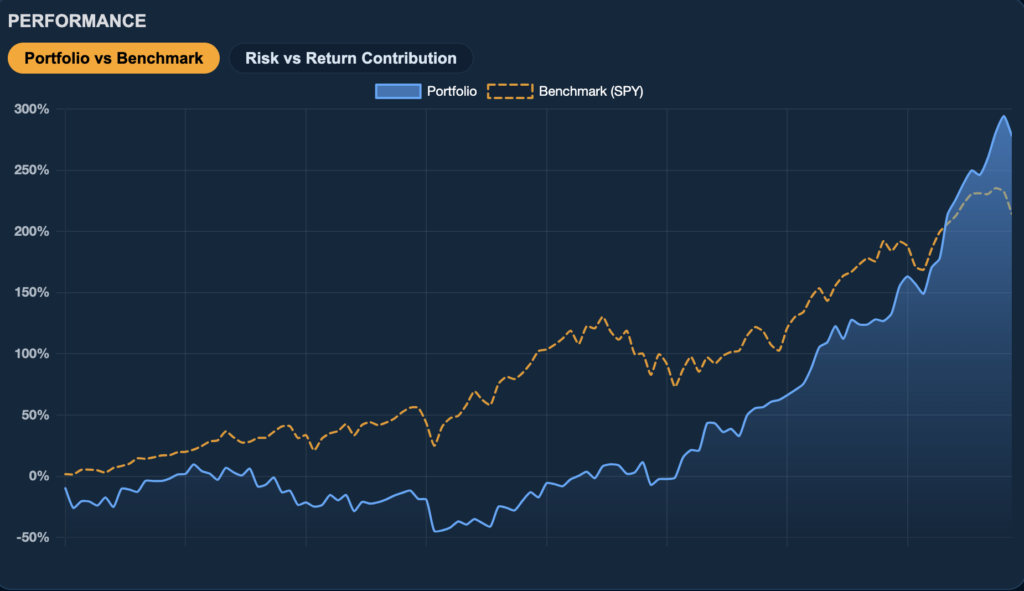
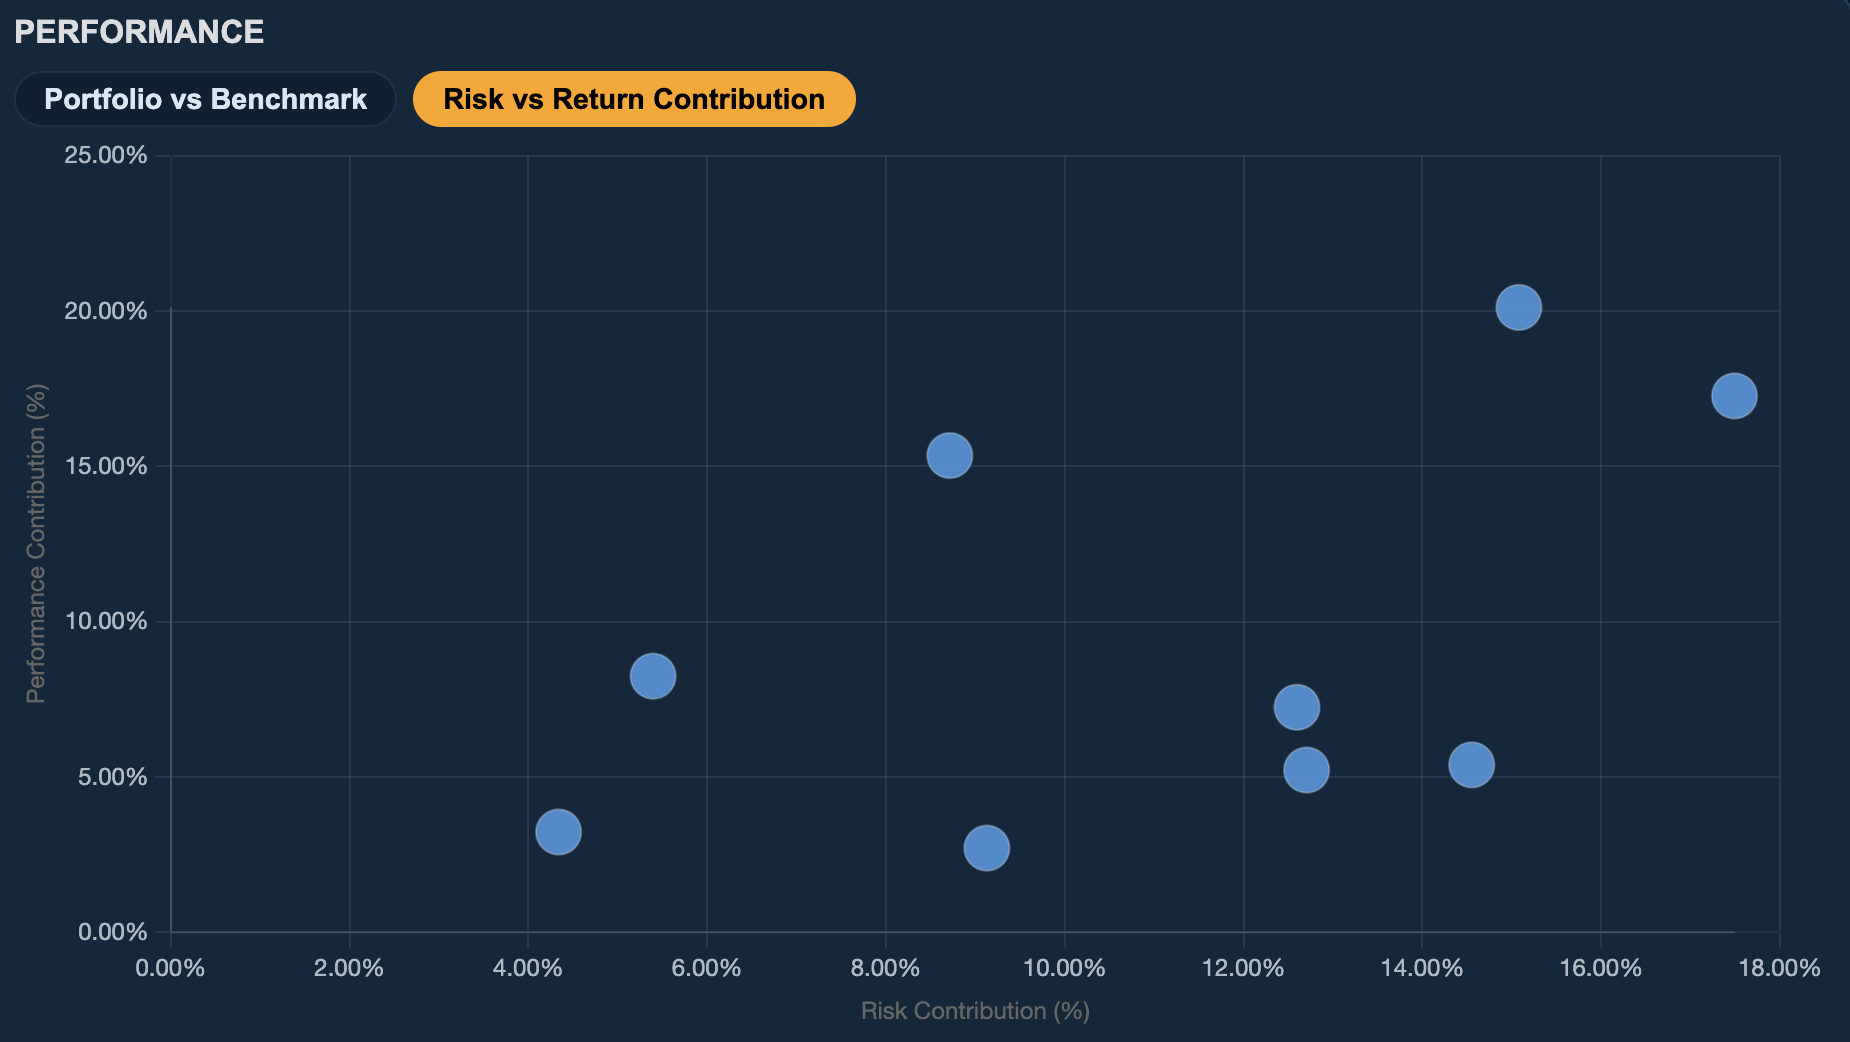
The second is Performance Analysis. This is where the portfolio is compared visually and analytically to its benchmark, and where each position is assessed not only by how much it contributes to performance, but also by how much risk it adds to the whole portfolio. The platform includes both a Portfolio vs Benchmark chart and a Risk vs Return Contribution map, which is one of the strongest elements of the feature because it allows the investor to understand immediately whether a position is helping the portfolio efficiently or simply consuming risk budget.
Used together, these two layers help the investor move from “What do I own?” to “Is this portfolio structurally worth owning?”
What problem it solves
The problem Portfolio Analysis solves is not lack of information. It is lack of structure.
Most investors already know what they hold. They know position sizes, entry levels and broad P&L. What they usually do not know is how the portfolio behaves as a portfolio.
That distinction is crucial.
A portfolio may contain five or ten positions that all looked attractive individually, yet still be poorly constructed. Several positions may be responding to the same macro factor. A single position may be contributing an excessive share of the total risk. The portfolio may look diversified by instrument count, but still be heavily dependent on equity beta. It may also be underperforming the benchmark even when some holdings are doing well, because the internal balance between return contribution and risk contribution is weak.
Without a proper analysis layer, these problems remain hidden until they show up through drawdowns, instability or persistent underperformance.
BTi addresses this by decomposing the portfolio into the dimensions that matter.
It calculates portfolio-level metrics using aligned monthly return series derived from price data, and then reconstructs the portfolio’s behaviour in terms of cumulative performance, rolling return structure, benchmark relationship and contribution by holding. The feature also computes variance-based risk contribution and performance contribution, which is exactly what an investor needs to identify which positions are improving the portfolio and which positions are simply increasing exposure.
This is especially important for active investors, because active management is not only about generating ideas. It is also about removing weak structure from the portfolio.
How Portfolio Analysis works inside BTi
The workflow in BTi is deliberately practical.
The analysis starts from a simple Portfolio Input section. The user types the instrument name, adds holdings to the portfolio, assigns an amount to each one and gives the portfolio a name. The module then allows the user to create a new portfolio, save it, reload previous versions and delete old configurations. This gives the feature a very concrete use case: it can be used to review a current live portfolio, compare a model portfolio against a live one, or test different portfolio versions over time. The underlying module explicitly supports saving and loading multiple portfolios and storing the last active portfolio state.
Once the portfolio has been entered, BTi processes the holdings and moves into the analysis stage.The first section shown is Portfolio Metrics. This section is deliberately structured in blocks so the investor can read the portfolio in layers rather than through one overloaded number. In the current interface, the metrics are grouped into four areas.
The first area is Long Term Annual Expected Return. This provides the return objective side of the portfolio and includes expected return, volatility of returns and the amount of risk taken for each 1% of return. This is a strong framing device because it immediately forces the investor to think in efficiency terms, not just in nominal return terms.
The second area is Market Related Risk. Here the platform displays beta, correlation with benchmark and benchmark-related movement. This is essential because it shows how much of the portfolio’s behaviour is really independent and how much is still tied to the market. The analyzer is explicitly connected to the shared benchmark logic used elsewhere in BTi, which means the reading is integrated rather than isolated.
The third area is Max Risk (95% Confidence). This is where the platform expresses downside risk through monthly, quarterly and annual Value at Risk style measures. These metrics matter because they convert portfolio uncertainty into practical loss scenarios over different horizons.
The fourth area is Current Price Positioning. This adds an important layer that many portfolio analysis tools ignore: the current location of the portfolio relative to recent highs and the all-time high structure. This allows the investor to connect long-term portfolio construction with the current market context rather than analysing the portfolio in a vacuum.
Portfolio vs Benchmark: why it matters
A portfolio cannot be evaluated in isolation.
Even if absolute returns are positive, the investor still needs to know whether the portfolio is behaving better or worse than the benchmark it should logically be compared against. A portfolio designed for active investors should not merely exist; it should justify its structure relative to the market.
This is why BTi includes a dedicated Portfolio vs Benchmark view.
The chart reconstructs cumulative portfolio returns and compares them visually to the selected benchmark over the same aligned time series. This is not just a cosmetic feature. It reveals whether the portfolio has produced actual relative value or whether it has simply followed the market with a weaker profile. It also shows how the performance gap evolves over time, which is useful for understanding whether underperformance is persistent, cyclical or concentrated in specific phases. The analiser module explicitly includes benchmark comparison as part of its performance card, and uses the benchmark setting shared with the rest of the platform.
This is where many portfolios are exposed for what they really are. A portfolio that looks sophisticated may simply be a diluted version of the benchmark. Another portfolio may lag in strong bull phases but hold up much better in weaker market regimes. Without a benchmark view, these patterns are often missed.
BTi makes them visible immediately.
Risk vs Return Contribution: the real diagnostic layer
If there is one element of the Portfolio Analysis page that should be strongly emphasised, it is the Risk vs Return Contribution map.
This is where the feature becomes genuinely diagnostic.
Most investors know which holdings are making or losing money. Very few know whether each holding is contributing to the portfolio in an efficient way. A position can generate positive return and still be a poor portfolio position if it absorbs too much risk. Another position can contribute modest return but play a highly valuable diversification role because it improves the balance of the overall structure.
BTi’s contribution map is designed exactly for this purpose.
The chart places holdings in a framework where return contribution and risk contribution can be compared visually, while point size reflects weight in the portfolio. This means the investor does not have to guess which positions are carrying the portfolio, which positions are oversized in risk terms, or which positions are under-delivering relative to the risk they introduce. The analyzer code explicitly renders a contribution map based on variance-driven risk contribution and performance contribution, which confirms that this is a real analytical layer, not just a visual effect.
This is an extremely powerful decision tool.
It helps answer questions such as:
Which positions are contributing positively both to return and to structural balance?
Which positions are large but not adding enough value?
Which positions are acting as risk concentrators?
Where is the portfolio’s real dependency sitting?
For an active investor, this is where portfolio review becomes actionable. It shows what to reduce, what to reconsider and what is genuinely improving the portfolio.
Check Against S&P 500: fast reality check
Another valuable detail in BTi’s Portfolio Analysis feature is the Check Against S&P 500 functionality.
This is not just a visual toggle. It is a fast diagnostic layer that highlights selected metrics relative to the S&P 500, giving the user an immediate benchmark reality check. The feature is explicitly implemented in the analyzer module to highlight chosen metrics versus the S&P 500 in green or red.
This matters because active investors often spend too much time analysing their own portfolio without stepping back and asking the simplest question: is this actually better than the market on the dimensions that matter?
A quick comparison can immediately reveal whether expected return is attractive enough, whether volatility is justified, whether beta is too high or too low for the intended objective, and whether the portfolio is being rewarded properly for the risk it is taking.
It is a small feature in interface terms, but a very strong feature in behavioural terms, because it forces discipline.
How to use Portfolio Analysis effectively
The best way to use Portfolio Analysis in BTi is not as a one-off report, but as a recurring portfolio review process.
The first step is to build or import the portfolio you want to analyse. This can be your real current portfolio, a proposed portfolio you are thinking of constructing, or an alternative version of an existing structure.
The second step is to read the Portfolio Metrics panel in order. Start with expected return and volatility, then move to market-related risk, then downside risk, and only then look at current positioning. That sequence matters because it forces the investor to understand the structure before reacting to the latest market location.
The third step is to move to Portfolio vs Benchmark. Here the goal is not to admire the chart, but to assess whether the portfolio has actually justified itself relative to the benchmark.
The fourth step is to use the Risk vs Return Contribution map as the main diagnostic tool. This is where positions should be examined critically. A holding that is large, risk-heavy and weak in return contribution should not be treated the same way as a holding that improves the balance of the portfolio.
The fifth step is to use Check Against S&P 500 as a discipline filter. If the portfolio does not compare well even on a simple first-pass benchmark test, that is usually a signal that the structure needs to be revisited.
This is how Portfolio Analysis should be used inside BTi: not as a passive report, but as a decision support engine.
Why active investors need this
Portfolio Analysis is often underestimated because it looks less exciting than idea generation.
That is a mistake.
For active investors, the difference between a good year and a mediocre one often depends less on finding one extra opportunity and more on managing the structure of the portfolio already in place. Capital allocation mistakes, unnoticed concentration, excessive beta, weak diversification and inefficient contribution profiles can quietly destroy performance even when the investor is good at selecting ideas.
This is exactly why BTi includes Portfolio Analysis as a dedicated feature.
The project is explicitly built for active investors with a dual objective: long-term portfolio efficiency and short-term alpha generation with diversification. Portfolio Analysis belongs to the part of the platform designed to help the user manage the quality of the portfolio itself, not only search for new trades.
A serious investment process needs both opportunity selection and portfolio control.
This feature provides the second.
Portfolio Analysis in BTi is not about showing a portfolio. It is about understanding it.
It allows the investor to input holdings, define real portfolio amounts, save portfolio structures, compare them to a benchmark, evaluate the portfolio through a complete risk-and-return framework, and diagnose each position through contribution analysis. The feature combines portfolio metrics, benchmark-relative performance and risk-versus-return contribution into a single analytical workflow, which is exactly what a professional active investor needs when reviewing a real portfolio.
That is the real value of Portfolio Analysis.
It does not tell you only whether the portfolio exists.
It tells you whether the portfolio makes sense.