What is short-term instrument analysis
Short-term instrument analysis is the process of evaluating how an asset is behaving in the current market environment.
Unlike long-term analysis, which focuses on structural quality over time, short-term analysis is designed to answer a different question:
how is this instrument behaving right now, relative to the market?
This includes understanding:
participation in positive market phases
resilience during negative phases
short-term asymmetry
momentum structure
volatility conditions
Inside BTi, short-term analysis is not based on subjective chart reading.
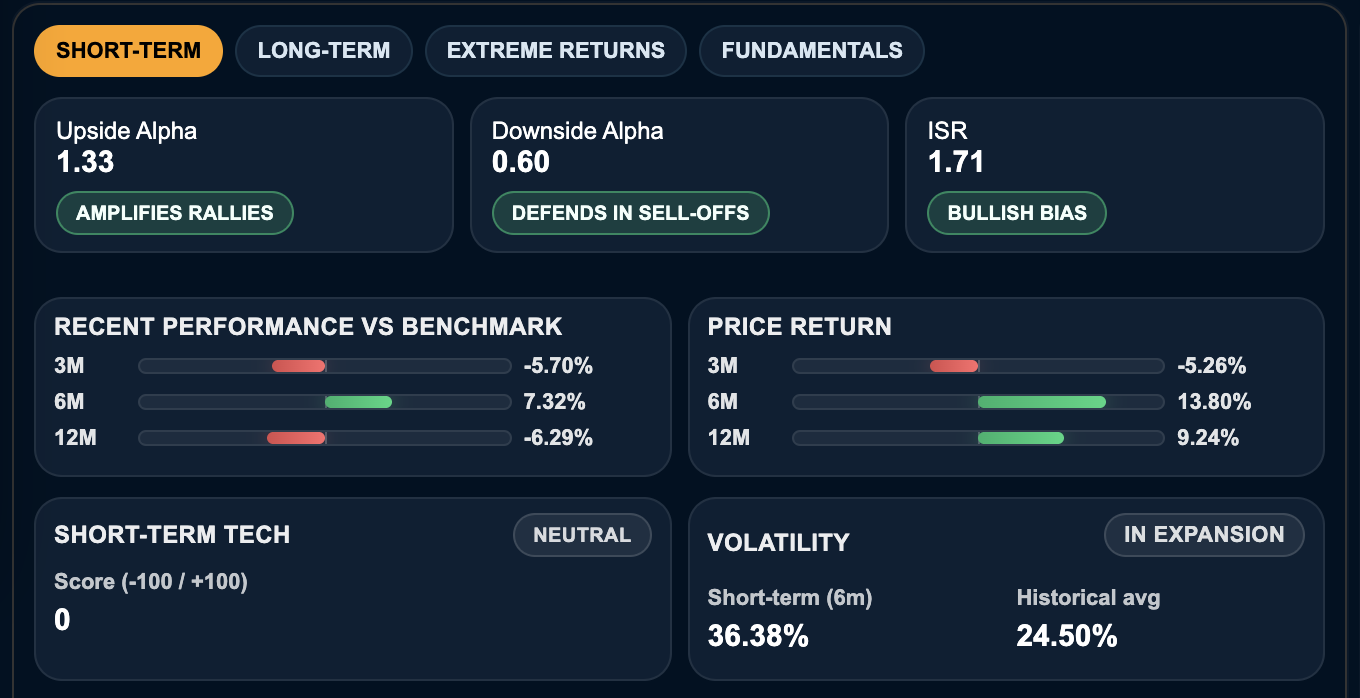
It is built as a structured framework using a small set of key indicators:
Upside Alpha
Downside Alpha
ISR (Internal Strength Ratio)
relative performance (3M / 6M / 1Y)
short-term technical structure
volatility regime
These are the core components used to evaluate short-term behaviour.
From price movement to behavioural analysis
Most short-term analysis is reactive.
Investors typically look at:
daily price changes
chart patterns
recent news
visual momentum
This approach is limited.
Price movement alone does not explain:
how efficiently an instrument reacts when the market rises
how it behaves when the market declines
whether its strength is consistent or fragile
whether volatility supports or undermines the move
BTi transforms the process from:
price observation → behavioural analysis
Instead of focusing on what price is doing, it focuses on how the instrument behaves relative to its environment.
Upside Alpha: participation in positive phases
The first key component is Upside Alpha.
Upside Alpha measures how an instrument performs when the benchmark is rising.
This answers a simple but critical question:
does the instrument participate efficiently when conditions are favourable?
A strong Upside Alpha indicates:
efficient participation in positive market phases
relative strength versus the benchmark
potential leadership behaviour
A weak Upside Alpha suggests:
underperformance in favourable conditions
lack of momentum quality
limited short-term attractiveness
This helps distinguish between instruments that are truly strong and those that are simply moving with the market.
Downside Alpha: resilience under pressure
The second key component is Downside Alpha.
This measures how an instrument behaves when the benchmark is negative.
This is often more important than upside behaviour.
An instrument that protects capital better during weak phases typically shows stronger structural resilience.
Downside Alpha helps answer:
does the instrument hold up when the market weakens?
A favourable Downside Alpha suggests:
reduced losses relative to the benchmark
defensive characteristics
resilience under stress
A poor Downside Alpha indicates:
amplified downside
fragility
exposure to negative market conditions
ISR: internal asymmetry
The third core component is ISR (Internal Strength Ratio).
ISR measures the internal balance between positive and negative behaviour.
It captures whether:
positive phases dominate negative ones
negative phases dominate positive ones
behaviour is balanced or asymmetric
This is critical because short-term strength is not just about direction, but about asymmetry.
An instrument becomes more interesting when:
it performs well when markets rise
it loses less when markets fall
ISR summarises this internal structure into a single metric.
Relative performance: context matters
Short-term signals must always be read in context.
This is why BTi includes relative performance over multiple horizons:
3 months
6 months
1 year
These measures help answer:
is the instrument outperforming the benchmark consistently?
is recent strength part of a broader trend or just a short-term move?
is weakness temporary or structural?
Without this context, short-term analysis becomes incomplete.
Technical structure: beyond visual charts
BTi includes a short-term technical framework that summarises price behaviour into a structured signal.
This is not based on subjective chart interpretation.
Instead, it integrates:
trend alignment
momentum
internal structure
The objective is to classify the instrument’s behaviour in a consistent and repeatable way.
This removes the subjectivity typically associated with chart reading.
Volatility regime: the missing dimension
One of the most overlooked aspects of short-term analysis is volatility.
An instrument may show strong signals but operate in an unstable volatility environment.
BTi addresses this by comparing:
current volatility
average volatility
This allows the platform to define a volatility regime.
This is critical because:
high volatility can increase risk
low volatility may support stability
changing regimes can invalidate signals
Volatility therefore acts as a filter on short-term interpretation.
The limitation of traditional short-term analysis
Most short-term tools are incomplete.
They focus on:
price
charts
indicators in isolation
They do not integrate:
benchmark-relative behaviour
asymmetry between positive and negative phases
volatility context
multi-horizon relative performance
This leads to:
false signals
overreaction
misinterpretation of strength
BTi addresses this by combining all relevant dimensions into a single framework.
Asymmetry: the core concept
At the heart of BTi’s short-term analysis is asymmetry.
An instrument is not attractive because it moves.
It becomes interesting when it behaves differently across market phases.
Specifically:
strong upside participation
controlled downside behaviour
favourable internal balance
This is why the combination of Upside Alpha, Downside Alpha and ISR is central.
It allows the investor to move from direction to quality of movement.
What problem this solves
The Short Term framework solves a key problem:
confusing activity with strength
An instrument can move sharply and still be weak.
It can appear stable and still be fragile.
It can look strong on a chart and still perform poorly relative to the benchmark.
BTi addresses this by focusing on:
behaviour, not just movement
relative performance, not absolute change
asymmetry, not direction alone
context, not isolation
How to use Short Term analysis in BTi
The workflow is structured and efficient.
The user:
selects an instrument and benchmark
analyses Upside Alpha
evaluates Downside Alpha
reviews ISR
checks relative performance
assesses technical structure
evaluates volatility regime
The process becomes:
measure → compare → interpret → prioritise
Why this is structurally different
Most platforms answer:
“Is the price moving?”
BTi answers:
“How is the instrument behaving relative to the market, across different phases, under the current volatility regime?”
This is a more advanced and useful question.
Regulatory positioning
BTi does not provide investment advice or recommendations.
The Short Term framework is an analytical tool designed to support independent evaluation.
The outputs:
are based on predefined calculations
are not personalised
do not consider individual financial circumstances
All decisions remain the responsibility of the user.
Short-term analysis in BTi is not about predicting short-term movements.
It is about understanding the quality of behaviour.
By combining alpha metrics, asymmetry, relative performance and volatility context, BTi provides a structured way to read near-term market dynamics.
This is the difference between reacting to price and interpreting it properly.