What is COT Report & Seasonality analysis
COT Report & Seasonality analysis is the process of understanding how certain markets behave through:
participant positioning
historical recurring patterns
This framework is particularly relevant for:
commodities
foreign exchange (FX)
These markets are not driven only by price and momentum.
They are heavily influenced by:
flows
hedging activity
macroeconomic dynamics
seasonal cycles
This makes them structurally different from equities.
Inside BTi, COT Report & Seasonality analysis provides a dedicated framework to study these dynamics in a consistent and measurable way.
Why commodities and FX require a different approach
Many investors apply the same tools across all asset classes.
They use:
charts
momentum indicators
basic technical analysis
This works reasonably well for equities.
It is often insufficient for commodities and FX.
These markets require additional layers of analysis because:
positioning matters
flows matter
macro sensitivity is higher
recurring patterns are more pronounced
Without these elements, analysis remains incomplete.
BTi addresses this by integrating positioning and seasonality into the core analytical framework.
COT Report: understanding market positioning
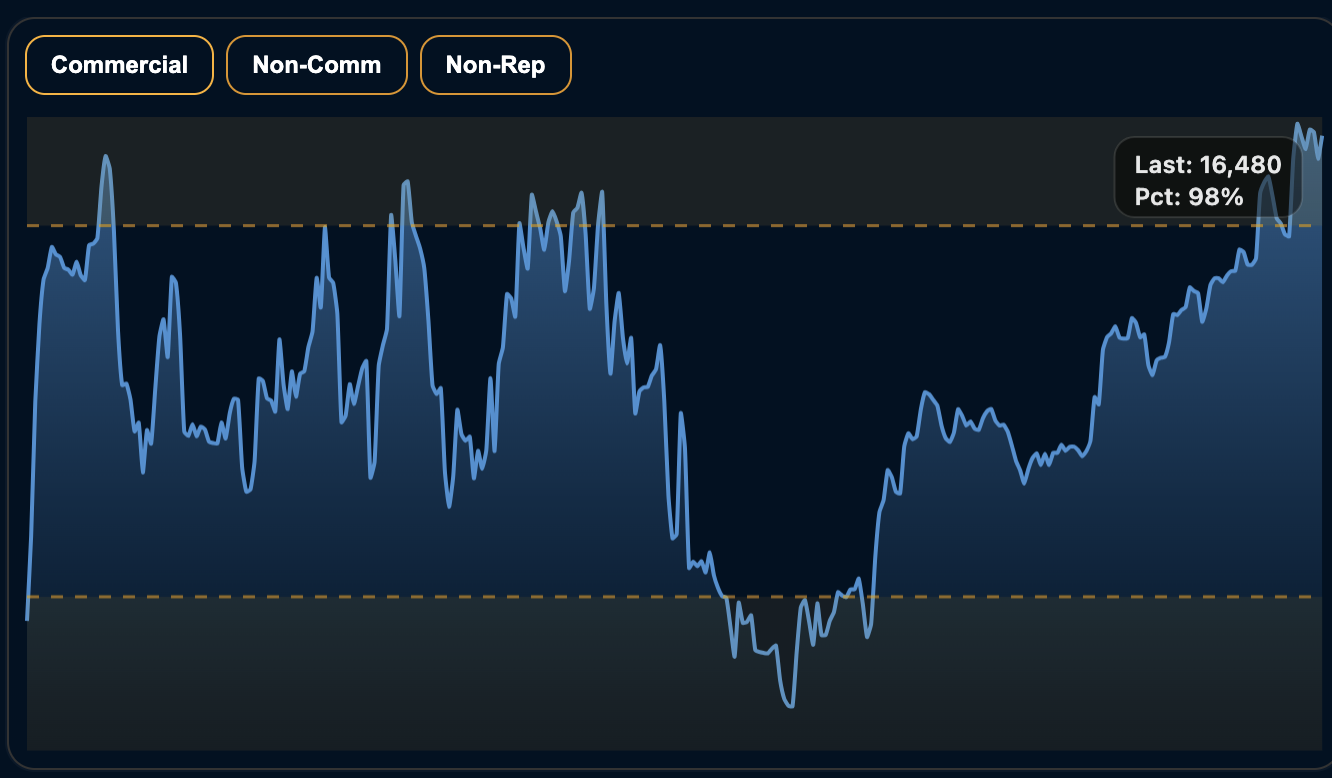
The Commitment of Traders (COT) Report provides insight into how different categories of market participants are positioned.
This is a key advantage because it moves analysis beyond price.
Instead of asking:
“What is the market doing?”
the investor can ask:
“Who is positioned in the market, and how extreme is that positioning?”
This is critical in commodities.
Commercial participants, for example, often represent:
– producers
– hedgers
– industrial users
Their positioning can reflect:
– underlying supply-demand dynamics
– hedging pressure
– structural imbalances
Extreme positioning can indicate:
– crowded trades
– potential reversals
– confirmation of strong trends
BTi integrates COT analysis directly into its commodity and FX framework, allowing the user to evaluate positioning in a structured way rather than through raw data alone.
Positioning extremes: what they really mean
Positioning becomes particularly useful at extremes.
When positioning is highly skewed, it can suggest:
– saturation of one side of the market
– reduced marginal buying or selling pressure
– increased probability of instability
However, extremes are not signals on their own.
They must be interpreted in context. For example:
an extreme can precede a reversal or it can persist during a strong trend. This is why COT data must be combined with other layers of analysis.
BTi provides that structure.
Seasonality: recurring market behaviour
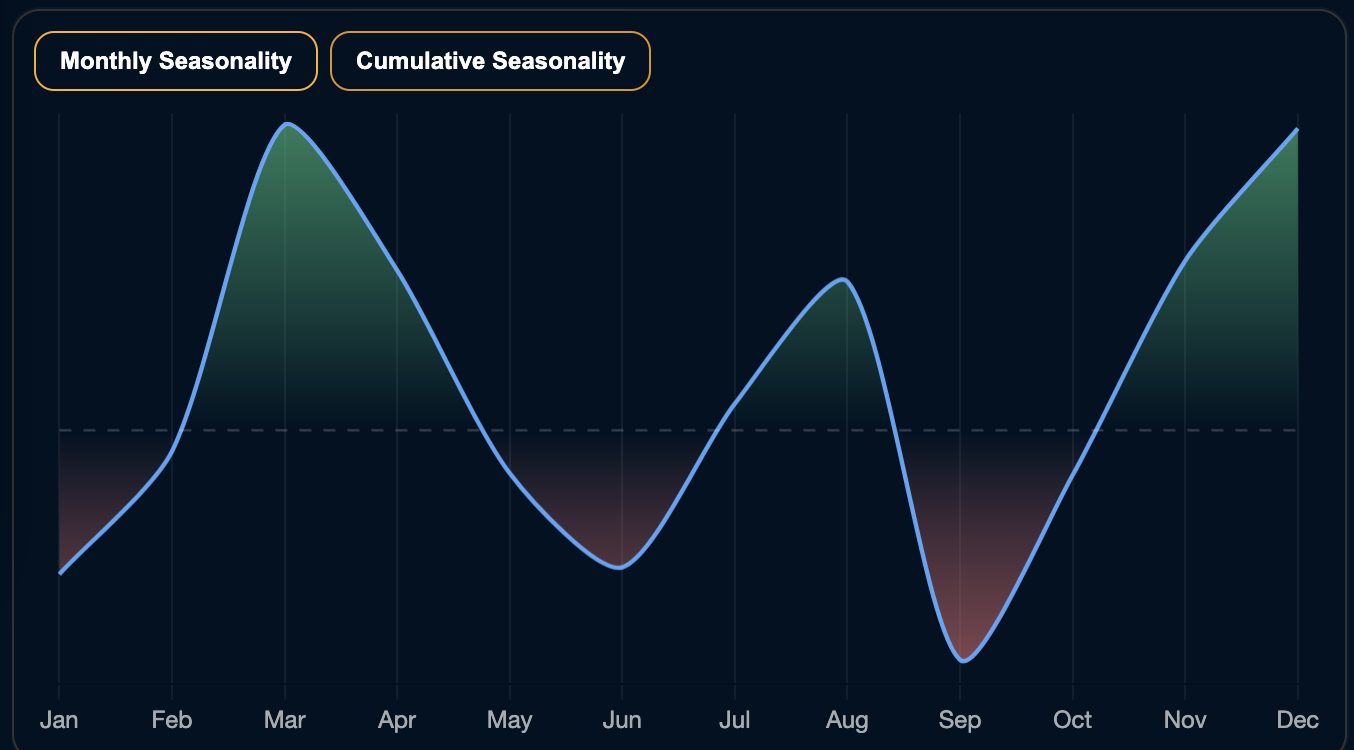
Seasonality refers to patterns that tend to repeat over time.
These patterns are particularly relevant in energy markets, agricultural, commodities, metals and certain currency relationships.
Seasonality is driven by production cycles, consumption patterns, inventory dynamics or macroeconomic timing.
Inside BTi, seasonality analysis allows the investor to understand whether the current period is historically supportive, neutral
or adverse. This provides a probabilistic framework rather than a deterministic prediction.
From historical pattern to probabilistic context
Seasonality does not guarantee future outcomes.
Its value lies in:
– probability
– tendency
– historical consistency
It helps answer: “How has this market typically behaved in this phase?”
This is particularly useful when combined with positioning.
For example:
– favourable seasonality + supportive positioning
– adverse seasonality + extreme positioning
– conflicting signals between the two
These combinations provide a deeper understanding of market structure.
Combining COT and Seasonality
The real strength of this framework lies in integration.
Individually:
COT provides insight into positioning
Seasonality provides insight into historical behaviour
Together, they provide context.
This allows the investor to distinguish between:
aligned conditions
neutral conditions
conflicting conditions
For example:
positioning supports the move and seasonality confirms it
positioning is extreme but seasonality is adverse
both layers suggest instability
This creates a more structured way to interpret commodities and FX.
FX: positioning and macro interaction
In FX markets, positioning plays a different but equally important role.
Currencies are influenced by:
interest rate differentials
macroeconomic expectations
capital flows
However, positioning still matters.
Extreme positioning in one currency can signal:
overcrowding
vulnerability to reversal
asymmetry in expectations
BTi integrates COT logic within the FX framework, allowing positioning to be analysed alongside macro context.
This is essential because FX cannot be read correctly without combining:
positioning
macro drivers
relative dynamics
The limitation of traditional analysis
Most platforms treat commodities and FX like equities.
They focus on:
charts
price levels
basic indicators
They ignore:
positioning
seasonal behaviour
flow dynamics
This leads to:
incomplete analysis
misinterpretation of trends
failure to identify structural conditions
BTi addresses this gap.
Market structure: the missing layer
The key concept behind COT Report & Seasonality is market structure.
Instead of focusing only on price, BTi allows the investor to understand:
how the market is positioned
how it tends to behave
whether conditions are aligned or conflicting
This provides a deeper level of analysis.
What problem this solves
This framework solves a major problem:
using the wrong tools for the wrong markets
Commodities and FX cannot be analysed effectively using only price-based tools.
BTi solves this by adding:
positioning analysis (COT)
historical pattern analysis (seasonality)
structured interpretation
This improves decision quality.
How to use COT Report & Seasonality in BTi
The workflow is structured.
The user:
selects a commodity or FX instrument
analyses COT positioning
evaluates seasonality
compares the two
interprets alignment or conflict
The process becomes:
position → pattern → combine → interpret
Why this is structurally different
Most tools provide data.
Some provide positioning.
Some provide seasonality.
BTi integrates all of them into a single framework.
Instead of asking:
“What is price doing?”
the investor asks:
“How is the market positioned, what does history suggest, and do these elements support each other?”
This is a higher-level question.
Regulatory positioning
BTi does not provide investment advice or recommendations.
The COT Report & Seasonality framework is an analytical tool.
The outputs:
are based on historical and positioning data
are not personalised
do not consider individual financial situations
All decisions remain the responsibility of the user.
COT Report & Seasonality analysis in BTi provides a structured way to understand markets where:
positioning matters
patterns repeat
flows drive behaviour
By combining these elements, BTi allows the investor to move beyond price and towards a deeper understanding of market dynamics.
This is the difference between observing a market and understanding its structure.