What is long-term instrument analysis
Long-term instrument analysis is the process of evaluating whether an asset is structurally attractive over time.
It goes beyond simple price observation or historical performance.
The objective is to understand how an instrument behaves across multiple dimensions, including:
return generation
risk exposure
benchmark dependency
volatility profile
downside behaviour
valuation, where applicable
In practical terms, long-term analysis answers a fundamental question:
does this instrument deserve capital allocation over time?
Inside BTi, long-term analysis is not reduced to isolated indicators.
It is built as a structured framework that combines:
benchmark comparison
regression-based modelling
risk-adjusted performance metrics
return distribution analysis
fundamental evaluation
This allows the investor to move from descriptive analysis to a more diagnostic understanding of the instrument.
From performance to quality
One of the most common mistakes in investing is confusing performance with quality.
An instrument can deliver strong historical returns and still be structurally weak.
It can underperform in the short term and still have a strong long-term profile.
Most traditional analysis focuses on:
price evolution
percentage returns
basic valuation ratios
This approach is incomplete.
It does not explain:
whether returns are generated efficiently
how much of the behaviour is driven by the market
how stable or unstable the return profile is
how the instrument behaves in adverse conditions
whether downside risk is concentrated in specific periods
BTi’s Long Term framework addresses this directly.
It transforms the process from:
observing results → analysing structure
Benchmark: the starting point of long-term analysis
An instrument should never be analysed in isolation.
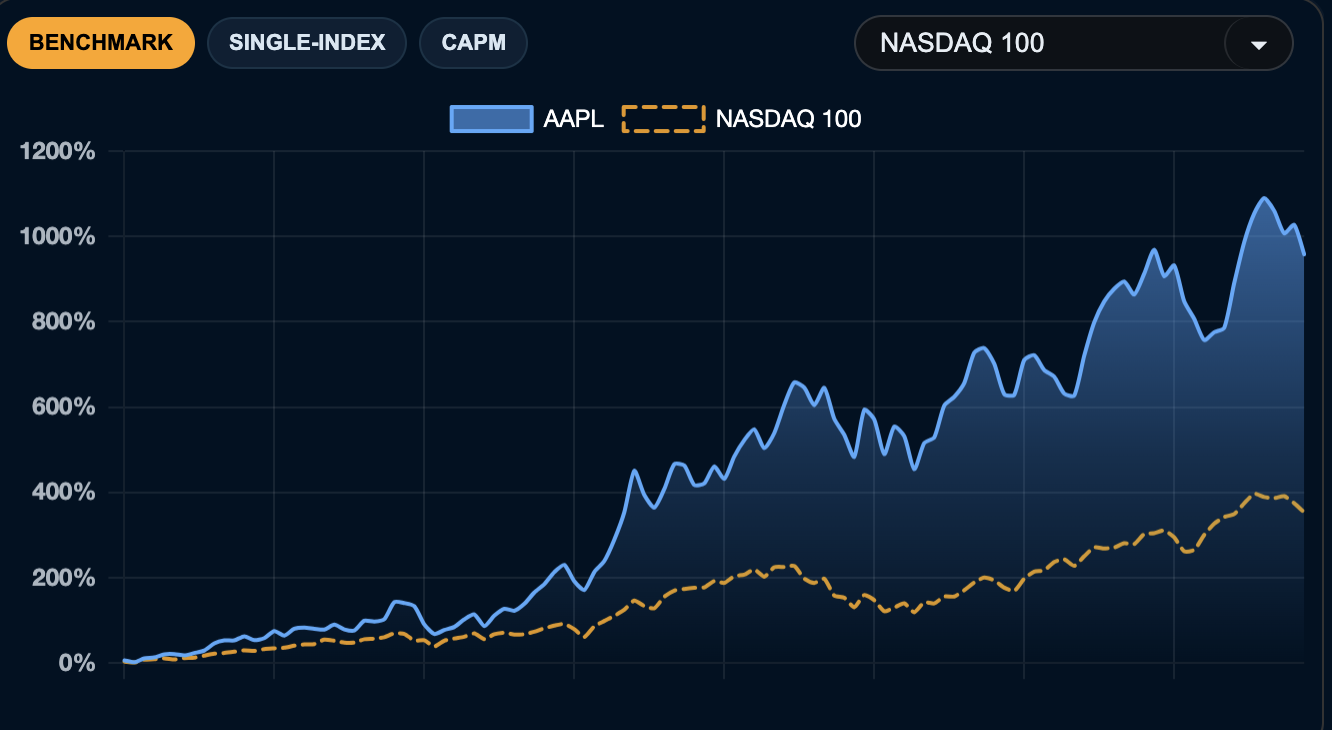
Its behaviour must be understood relative to the market it belongs to. This is why the first layer of analysis in BTi is the benchmark comparison. The platform allows the investor to:
compare cumulative performance against a benchmark
evaluate periods of outperformance and underperformance
understand relative strength over time. This is critical because an instrument can look strong in absolute terms but still fail to outperform the benchmark. Conversely, an instrument may appear weak while actually demonstrating relative resilience.
The benchmark comparison therefore provides the first structural insight: is the instrument adding value relative to the market?
Single-Index Model: understanding market dependency
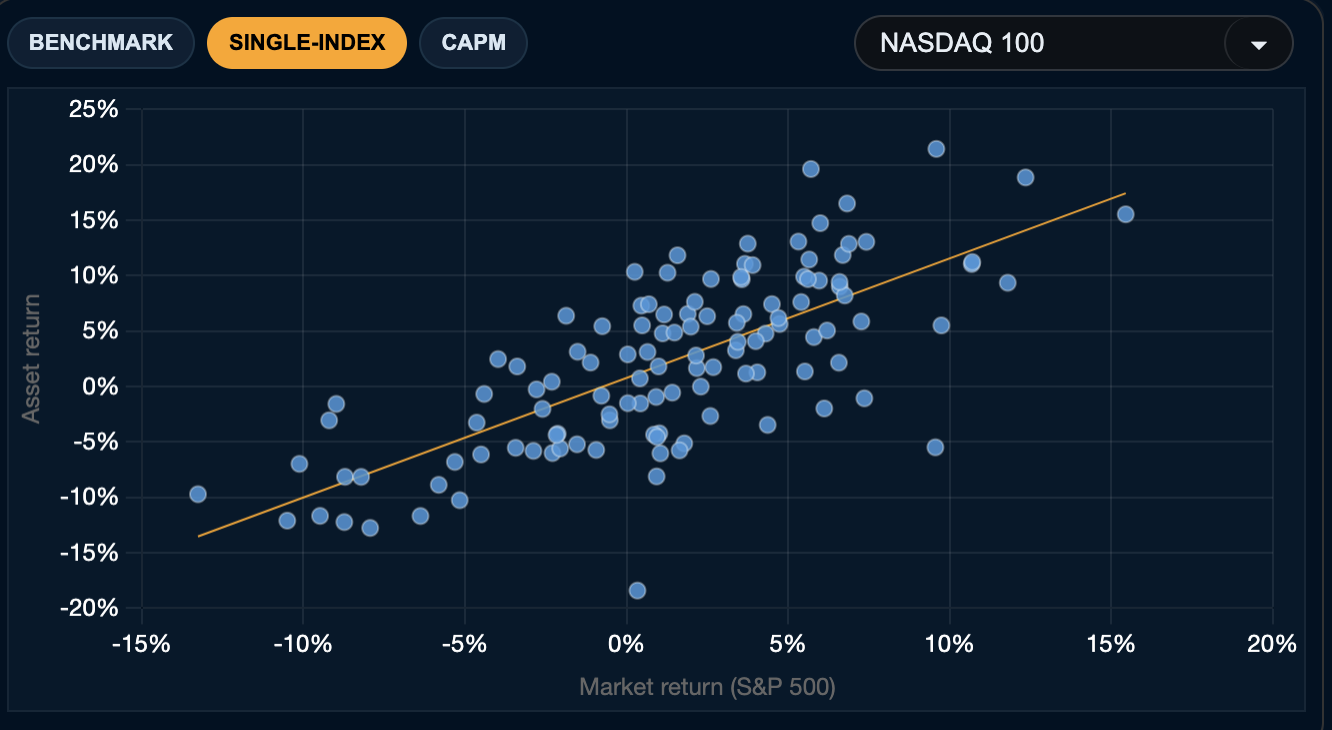
The next layer is the Single-Index Model.
This model studies the relationship between the instrument’s returns and the benchmark’s returns. Instead of looking only at price evolution, it analyses: correlation, regression relationship, dispersion of returns. The objective is to understand how much of the instrument’s behaviour is explained by the market.
This helps answer key questions: is the instrument mostly driven by the benchmark, or does it behave independently?
This layer is particularly important for portfolio construction, because instruments that are too strongly tied to the benchmark may not provide meaningful diversification.
CAPM: return versus risk
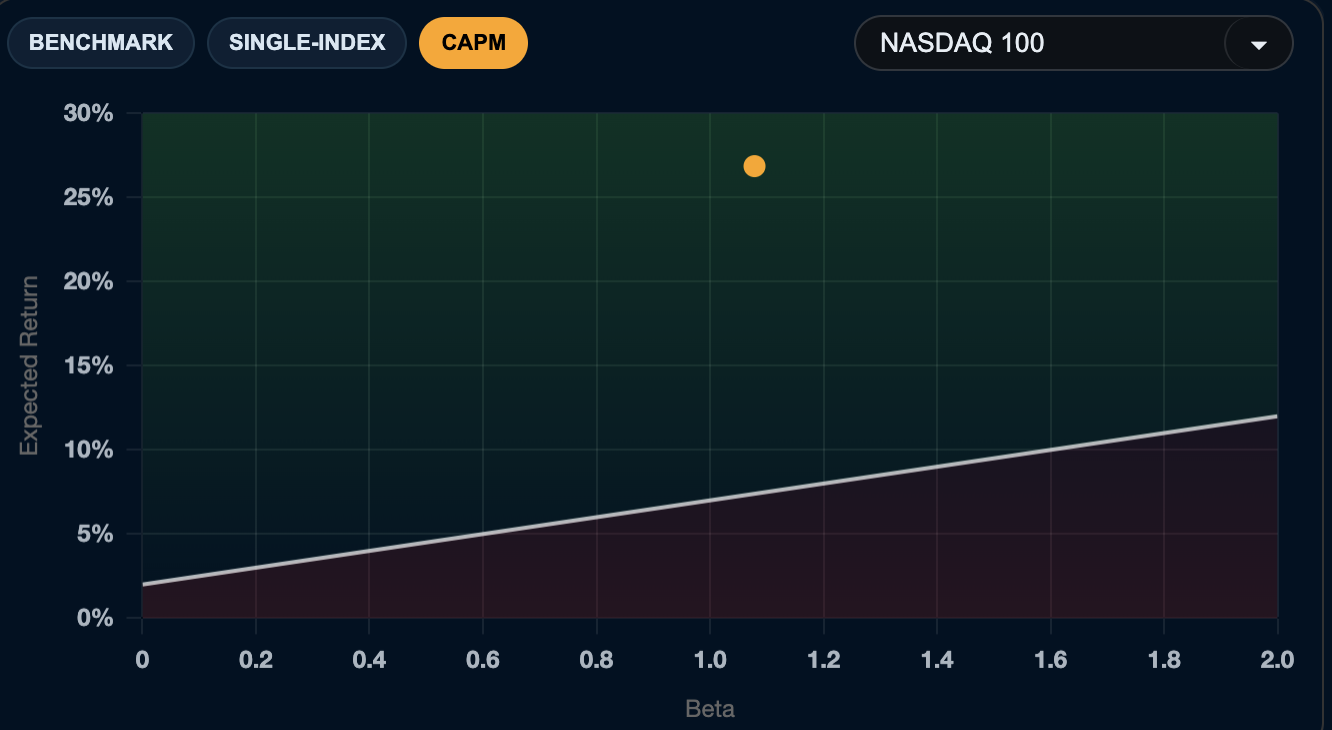
The Capital Asset Pricing Model (CAPM) introduces another critical dimension.
It evaluates return relative to beta, which represents exposure to market risk.
This allows the investor to distinguish between:
return generated through risk exposure
return generated efficiently relative to that risk
Two instruments may deliver similar returns, but if one requires significantly higher market exposure, its quality is lower from a portfolio perspective.
CAPM helps answer:
is the return profile justified by the level of risk taken?
Long-Term Risk and return: the institutional framework
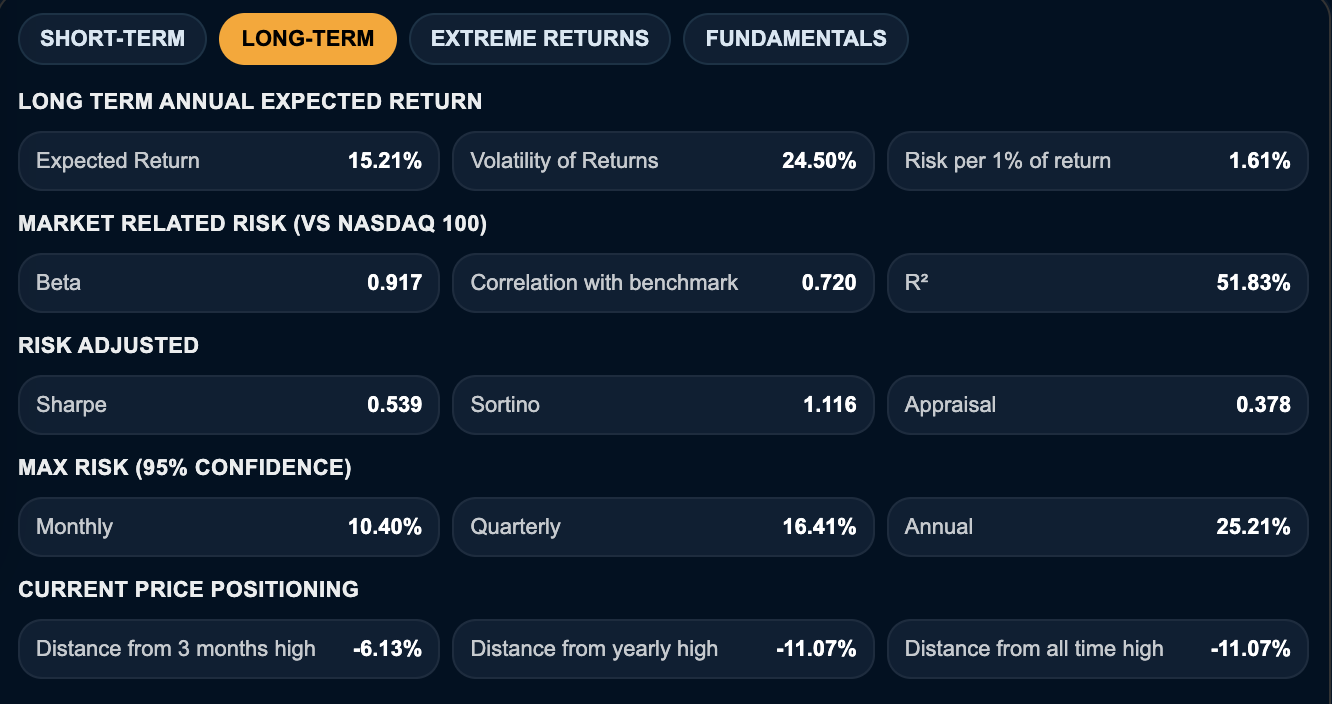
BTi expands the analysis into a full risk-and-return framework.
This includes: expected return, volatility, beta, correlation, benchmark explained movement, Sharpe ratio, Sortino ratio, Information ratio, Appraisal ratio, Modigliani measure. These metrics are not independent. Together, they describe:
– how efficiently the instrument generates returns
– how much risk is taken to achieve them
– how consistent performance is
– how the instrument compares to the benchmark
This transforms long-term analysis into a structured evaluation similar to institutional portfolio analysis.
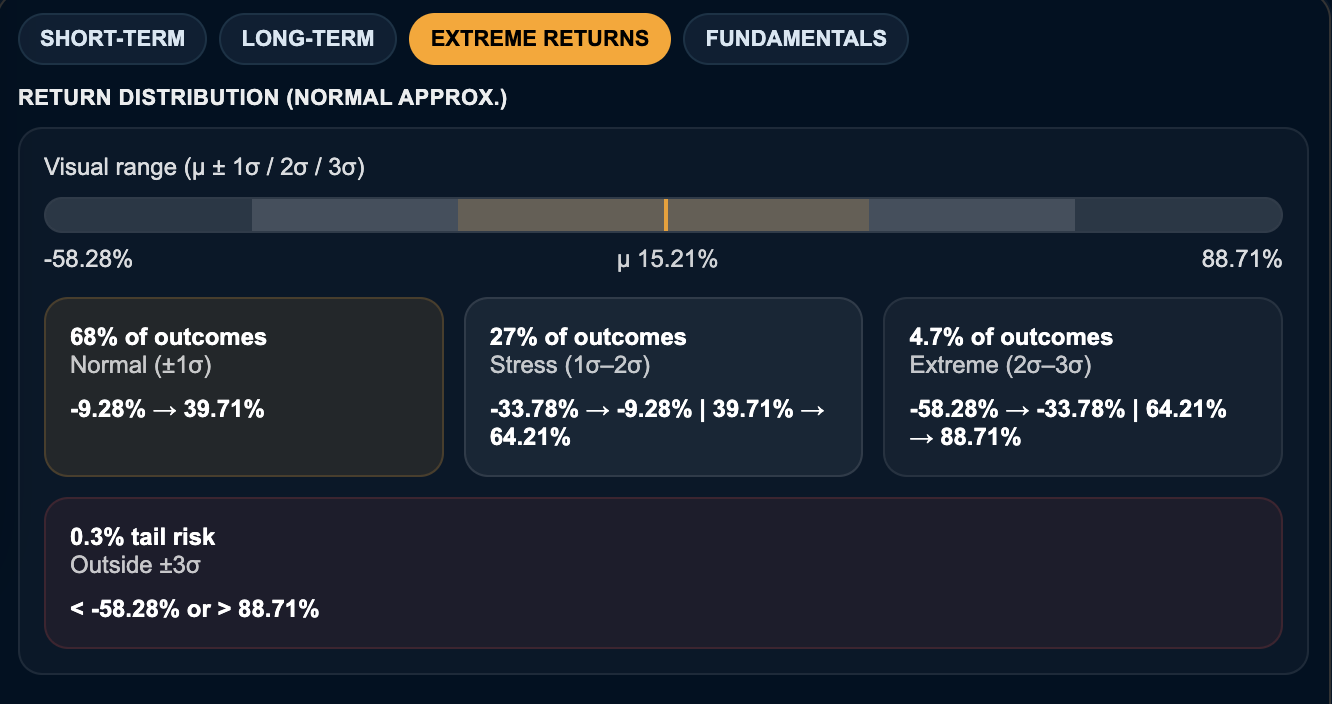
Return distribution and tail risk
Average return alone is not enough to understand risk.
Two instruments can have identical average returns and completely different risk profiles. This is where return distribution becomes essential. BTi allows the investor to analyse how monthly returns are distributed over time. This reveals: dispersion of returns, asymmetry and frequency of extreme events.
This is particularly important for identifying tail risk.
An instrument may appear attractive on average but hide
occasional severe drawdowns, unstable compounding or negative skew. Return distribution helps uncover these hidden risks.
Price positioning: context matters
Long-term analysis also includes price positioning.
This involves measuring:
distance from recent highs
distance from all-time highs
relative positioning within historical range
This does not replace deeper analysis.
However, it adds important context.
An instrument with strong fundamentals and solid long-term metrics may still be:
extended
overbought
close to historical extremes
Conversely, a structurally solid instrument may be trading at a more favourable point within its historical range.
Fundamental analysis: the business layer
For equities, BTi integrates a full fundamental analysis layer.
This includes:
-EPS
– P/E ratio
– P/B ratio
– earnings yield
– dividend yield
– dividend cover
These metrics are also compared to:
– broad market averages
– index benchmarks
– sector or industry groups
This allows the investor to move from price-based analysis to business quality and valuation.
The objective is to answer:
– is the valuation consistent with the quality of the instrument?
– is the market pricing growth, stability or risk correctly?
Fundamental analysis therefore complements the statistical and risk-based framework.
The limitation of traditional long-term analysis
Most platforms stop at:
charts
basic ratios
headline performance
They do not provide a fully integrated framework.
This leads to several problems:
overreliance on price
misinterpretation of performance
underestimation of risk
inability to connect different dimensions of analysis
BTi addresses this by integrating all layers into a single structure.
What problem this solves
The Long Term framework solves a critical problem:
lack of structure in instrument evaluation
Investors often have access to data but lack a consistent process.
BTi provides that process by combining:
benchmark comparison
regression analysis
risk-return evaluation
distribution analysis
fundamental metrics
This reduces noise and improves decision quality.
How to use Long Term analysis in BTi
The workflow is structured and repeatable.
The user:
selects an instrument and benchmark
analyses benchmark comparison
reviews Single-Index Model
evaluates CAPM
studies risk and return metrics
checks return distribution
reviews fundamentals (if applicable)
The process becomes:
compare → model → evaluate → interpret
Why this is structurally different
Most tools provide data.
Some tools provide indicators.
BTi provides a framework.
Instead of asking:
“Has this instrument performed well?”
the investor asks:
“Is this instrument structurally attractive, efficient and consistent enough to justify long-term allocation?”
This is a fundamentally different level of analysis.
Regulatory positioning
BTi does not provide investment advice or recommendations.
The Long Term analysis framework is an analytical tool designed to support independent evaluation.
The outputs:
are based on historical and quantitative data
are not personalised
do not consider individual financial circumstances
All decisions remain the responsibility of the user.
Long-term analysis in BTi is not about looking further back in time.
It is about understanding structure.
By combining benchmark analysis, modelling, risk metrics, distribution and fundamentals, BTi transforms instrument analysis into a disciplined process.
This is the difference between observing performance and understanding it.